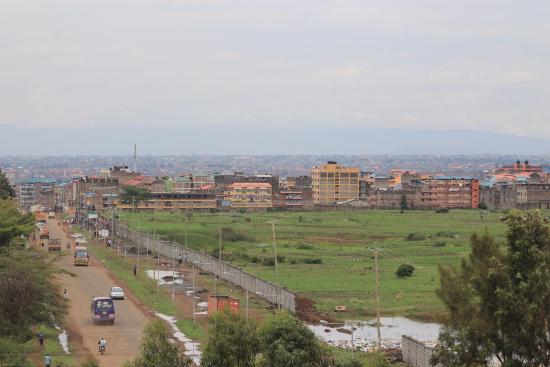
Nairobi Land Prices: Cytonn Investments has released its latest list of prices for land in the Nairobi Metropolitan Area. The prices show that the the land sector recorded a price decline last year due to an overall slowdown in real estate investment during the year. Despite the rest of the zones recording a decline in asking prices, unserviced land in satellite towns such as Ruiru and Limuru registered a rise in prices.
Man who claimed to make Sh. 20m a month now behind Banda scandal
Below is the breakdown showing how prices of land have been rising per acre in the NMA since 2011:
| LAND PERFORMANCE ACROSS ALL NMA REGIONS | ||||||||||
| Location | *Price in 2011 | *Price in 2015 | *Price in 2016 | *Price in 2017 | *Price 2018/19 | *Price 2019/20 | 8- Year CAGR | 2018/19 Capital Appreciation | 2019/20 Capital Appreciation | ∆ in capital appreciation |
| Satellite Towns – Unserviced Land | 9m | 17m | 22m | 23m | 24m | 25m | 15.8% | 3.9% | 3.8% | (0.1%) |
| Nairobi Suburbs – Low Rise Residential Areas | 36m | 68m | 79m | 82m | 81m | 84m | 11.3% | (0.9%) | 3.8% | 4.8% |
| Satellite Towns – Site and Service Schemes | 8m | 15m | 18m | 15m | 15m | 15m | 15.1% | (0.5%) | 0.5% | 1.0% |
| Nairobi Suburbs – High rise Residential Areas | 52m | 92m | 111m | 117m | 117m | 116m | 11.0% | (1.6%) | 0.0% | 1.5% |
| Nairobi Suburbs – Commercial Areas | 145m | 359m | 422m | 433m | 421m | 419m | 14.5% | (2.2%) | (0.7%) | 1.5% |
| Average | 13.5% | (0.3%) | 1.5% | 1.8% | ||||||
*Asking land prices
|
||||||||||
| Unserviced Land in Satellite Towns | ||||||||||
| Location | *Price in 2011 | *Price in 2015 | *Price in 2016 | *Price in 2017 | Price 2018/19* | *Price 2019/20 | 8- year CAGR | 2018/19 Capital Appreciation | 2019/20 Capital Appreciation | ∆ in capital appreciation |
| Satellite Towns – Unserviced Land | ||||||||||
| Ruiru | 7m | 15m | 19m | 20m | 21m | 22m | 16.5% | 6.5% | 6.2% | (0.3%) |
| Ruaka | 40m | 58m | 74m | 77m | 80m | 84m | 9.8% | 4.0% | 5.2% | 1.2% |
| Utawala | 6m | 9m | 10m | 11m | 12m | 12m | 9.7% | 5.6% | 4.1% | (1.4%) |
| Athi River | 2m | 3m | 4m | 4m | 4m | 4m | 10.1% | 3.1% | 3.4% | 0.3% |
| Juja | 3m | 7m | 9m | 10m | 10m | 10m | 15.3% | 1.0% | 3.4% | 2.4% |
| Limuru | 5m | 13m | 17m | 20m | 20m | 21m | 18.4% | 4.5% | 2.9% | (1.7%) |
| Ongata Rongai | 2m | 10m | 18m | 18m | 18m | 19m | 31.2% | 2.2% | 1.6% | (0.7%) |
| Average | 9m | 17m | 22m | 23m | 24m | 25m | 15.8% | 3.9% | 3.8% | (0.1%) |
*Asking land prices
|
||||||||||
| Low Rise Residential Areas | ||||||||||||
| Location | *Price in 2011 | *Price in 2015 | *Price in 2016 | *Price in 2017 | *Price 2018/19 | *Price 2019/20 | 8- Year CAGR | 2018/*19 Capital Appreciation | 2019/20 Capital Appreciation | ∆ in capital appreciation | ||
| Low Rise Residential Areas | ||||||||||||
| Karen | 25m | 40m | 46m | 52m | 53m | 56m | 10.7% | 3.4% | 5.6% | 2.2% | ||
| Spring Valley | 64m | 131m | 147m | 154m | 148m | 156m | 11.7% | (4.1%) | 5.4% | 9.5% | ||
| Runda | 33m | 58m | 67m | 68m | 68m | 70m | 9.8% | 0.2% | 3.3% | 3.1% | ||
| Kitisuru | 32m | 59m | 70m | 70m | 71m | 73m | 10.8% | 0.8% | 3.0% | 2.2% | ||
| Ridgeways | 24m | 51m | 62m | 68m | 65m | 66m | 13.5% | (4.9%) | 1.8% | 6.7% | ||
| Average | 36m | 68m | 79m | 82m | 81m | 84m | 11.3% | (0.9%) | 3.8% | 4.8% | ||
*Asking land prices
|
||||||||||||
| Serviced Land –Satellite Towns | ||||||||||
| Location | *Price in 2011 | *Price in 2015 | *Price in 2016 | *Price in 2017 | *Price 2018/19 | *Price 2019/20 | 8- Year CAGR | 2018/19 Capital Appreciation | 2019/20 Capital Appreciation | ∆ in capital appreciation |
| Site and service schemes | ||||||||||
| Ruiru | 8m | 18m | 19m | 21m | 23m | 24m | 17.5% | 8.1% | 5.8% | (2.2%) |
| Athi River | 2m | 11m | 13m | 13m | 12m | 12m | 25.6% | (7.3%) | 3.5% | 10.8% |
| Ruai | 8m | 12m | 13m | 15m | 14m | 14m | 7.4% | (9.4%) | 1.0% | 10.4% |
| Thika | 5m | 7m | 8m | 10m | 10m | 10m | 9.0% | 1.7% | 0.5% | (1.2%) |
| Syokimau-Mlolongo | 3m | 12m | 12m | 12m | 12m | 12m | 18.0% | 3.5% | (3.8%) | (7.3%) |
| Ongata Rongai | 7m | 16m | 19m | 19m | 19m | 18m | 12.9% | 0.4% | (3.8%) | (4.3%) |
| Average | 8m | 15m | 18m | 15m | 15m | 15m | 15.1% | (0.5%) | 0.5% | (2.2%) |
*Asking land prices
|
||||||||||
| High Rise Residential Areas | ||||||||||
| Location | *Price in 2011 | *Price in 2015 | *Price in 2016 | *Price in 2017 | *Price 2018/19 | *Price 2019/20 | 8- Year CAGR | 2018/19 Capital Appreciation | 2019/20 Capital Appreciation | ∆ in capital appreciation |
| High Rise Residential Areas | ||||||||||
| Kasarani | 32m | 51m | 60m | 64m | 61m | 65m | 9.2% | (3.6%) | 5.7% | 9.3% |
| Dagoretti | 28m | 81m | 95m | 99m | 100m | 103m | 17.8% | 1.5% | 2.5% | 1.0% |
| Githurai | 21m | 37m | 45m | 46m | 45m | 44m | 10.2% | (0.9%) | (1.4%) | (0.5%) |
| Kileleshwa | 149m | 227m | 286m | 306m | 311m | 303m | 9.3% | 1.8% | (2.6%) | (4.4%) |
| Embakasi | 33m | 61m | 69m | 70m | 66m | 63m | 8.5% | (6.7%) | (4.4%) | 2.3% |
| Average | 52m | 92m | 111m | 117m | 117m | 116m | 11.0% | (1.6%) | 0.0% | 1.6% |
*Asking land prices
|
||||||||||
| Commercial Zones | ||||||||||
| Location | *Price in 2011 | *Price in 2015 | *Price in 2016 | *Price in 2017 | *Price 2018/19 | *Price 2019/20 | 8- Year CAGR | 2018/*19 Capital Appreciation | 2019/20 Capital Appreciation | ∆ in capital appreciation |
| Commercial Zones | ||||||||||
| Upper Hill | 200m | 450m | 512m | 510m | 488m | 506m | 12.3% | (4.4%) | 3.8% | 8.1% |
| Kilimani | 114m | 294m | 360m | 387m | 403m | 398m | 16.9% | 4.1% | (1.2%) | (5.3%) |
| Westlands | 150m | 350m | 453m | 474m | 430m | 421m | 13.8% | (9.3%) | (1.9%) | 7.4% |
| Riverside | 116m | 343m | 362m | 361m | 363m | 351m | 14.8% | 0.7% | (3.3%) | (4.0%) |
| Average | 145m | 359m | 422m | 433m | 421m | 419m | 14.5% | (2.2%) | (0.7%) | 1.5% |
| *Asking land price
*Key to note the Nairobi CBD was exempted from the list of submarkets within the commercial zones, due to unavailability of undeveloped land for sale
|
||||||||||


